School of Library and Information Science
in the United States
U.S. News & World Report ranks Simmons' Master of Library and Information Science program among the nation's Top 10.
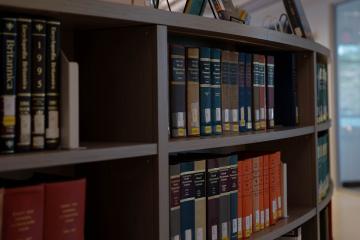
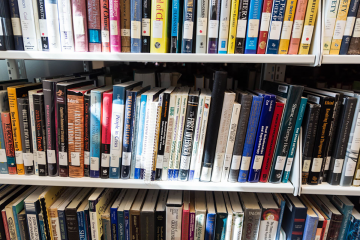
The School of Library and Information Science (SLIS) is an ALA-accredited, nationally recognized leader, featuring top-rated faculty, prestigious alumnae/i, and excellent locations in Boston and Western Massachusetts. Consistently ranked among the country's top programs — including #1 for Archival Management — SLIS offers flexible learning formats that allow you to tailor your experience to fit your goals and interests.

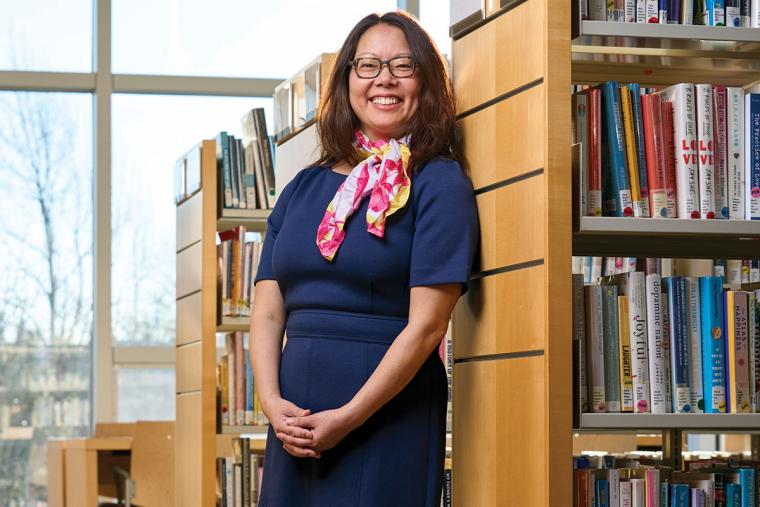
Meet the Dean
“The high rankings our programs achieve are a testament to the dedication, passion, and talent of our faculty, and reflect the tremendous skill and impact of Simmons alumnae/i who are working in the national LIS landscape.”
Embrace Our Mission
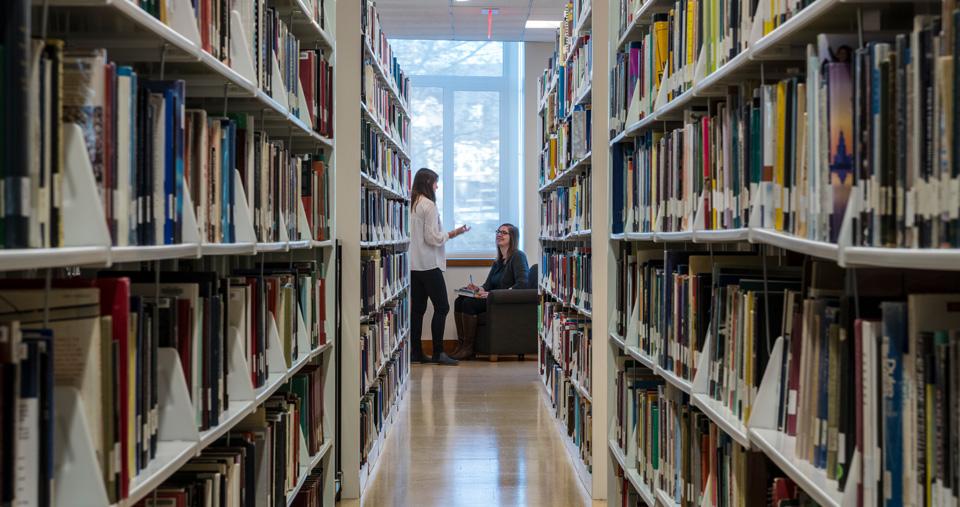
At Simmons, our focus is on you. We offer a learning experience that emphasizes collaboration and personal interaction, unlike larger universities.

Take the Next Step
Join a community where you will have direct access to faculty who know your name and understand your goals. Work closely with classmates in an engaging, supportive classroom environment, whether in person or online.
Tap into Your Potential
At the School of Library and Information Science, we're dedicated to helping you build a successful career with flexible programs tailored to your needs. Choose from full- or part-time study, evening and weekend classes, online and hybrid courses, and post-master's opportunities.
Get Involved, Get Inspired
Our Master of Science in Library and Information Science program — offered on campus, online, and hybrid — features concentrations in archives management, cultural heritage informatics, information science and technology, libraries and librarianship, and school library teacher.
Discover the Information Science & Technology (IS&T) Lab, a hub for research and exploration for LIS students. Its mission is to create synergy, provide structure, and encourage collaboration among doctoral and master's degree students.
Read and contribute to The Student Experience Blog. Maintained by the SLIS Admissions Office, the blog provides a window into the daily life and thoughts of students like you.
What Makes Us Different?
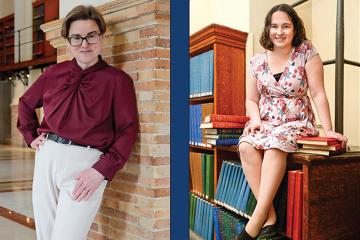
“Simmons has challenged me to think more deeply about my field and its history. My professors have given me tools to form a strong archival ethic and sense of justice.”
Sarah Shepherd ’23MAMS
“It is a groundbreaking and special program. We had amazing professors of practice who are big leaders in the field. It was this fertile environment to explore concepts and learn how to write different types of papers and read and conduct research.”
Maria McCauley ’17PhD
“When I was abroad, I mentioned Simmons to a librarian in the UK, and he said he knew of it, and that it was a good program. At that point, I realized that Simmons is known internationally among librarians. I feel that if I apply for a job anywhere in the world, they will recognize the value of a Simmons LIS degree.”
Diana Myers ’24MS
Spotlight on SLIS Students and Alums
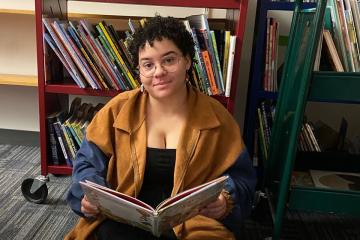
Metafiction as a Willingness to Play
Rosie Lopolito ’29MA/MS shares how a diverse array of experiences led her to the Children’s Literature (MA) and Library and Information Science (MS) dual degree program at Simmons University.
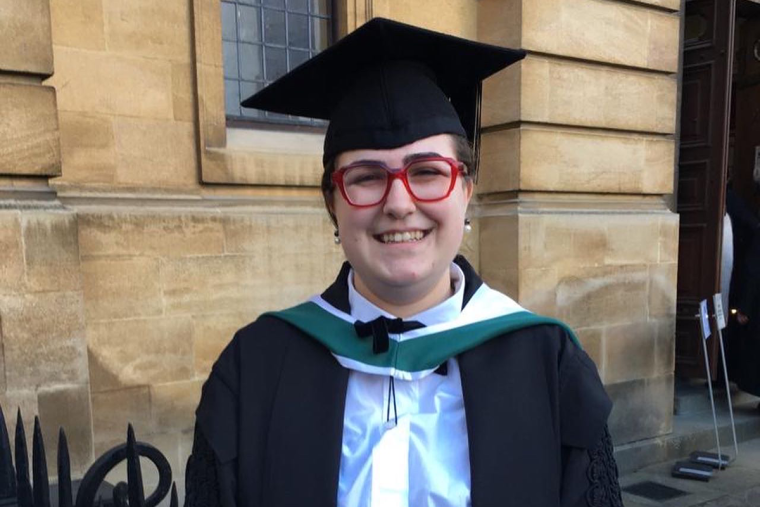
Sharing the Untold Stories at Queer History Boston
Mik Hamilton '24MS ‘24MA is the archivist at Queer History Boston, a community archive dedicated to collecting, preserving, and sharing the rich LGBTQ+ histories of Boston and New England. Hamilton shares how the dual degree in LIS: archives management and history at Simmons prepared them for a dream job just before graduation.
SLIS Alumnae/i Named Movers & Shakers
Jessica Chapel ’19MS and Katelyn Duncan ’16MS were selected for the 2026 Movers & Shakers by Library Journal.
Dual Degree Alumnus Found His Voice at Simmons
Alec Chunn '15MA/MS reflects on how the Children's Literature & Library Science dual degree has informed his work as a reviewer of children's literature, a jurist for literary prizes, and a Youth Librarian at Multnomah County Library in Portland, Oregon.
Examining Critical Roles of School Librarians
Kimberly R. Lavoie PhD’26 reflects on the most impactful part of her doctoral journey: conducting dissertation research, examining how school librarians understand and enact their roles in post-pandemic K–12 education.
Public Librarianship and Community Involvement
Sydney Villegas ’26MS reflects on how she was encouraged to bring her interests and passions to her coursework and create projects that she was genuinely excited to explore as a graduate student in library and information science.
SLIS Alumna Honored with ‘I Love My Librarian’ Award
Joanne Doucette ’01MS is a 2026 honoree of the "I Love My Librarian" Award. She is one of ten honorees selected from more than 1,300 nominations from library users nationwide.
Specializing in Visual Literacy and Women’s Military History
Aurora Daniel ’26MSMA had the honor of serving as the president of the Library and Information Science Student Association, the student government for Simmons’ School of Library and Information Science while pursuing her Masters in Library and Information Science and Master of Arts in History.
SLIS Highlights
ALA Accredited
SLIS has met the ALA Accreditation Standards, an important accreditation because an ALA-accredited master's degree is essential to obtain most professional positions in the LIS field, and is required by many states for public and school librarians.
3
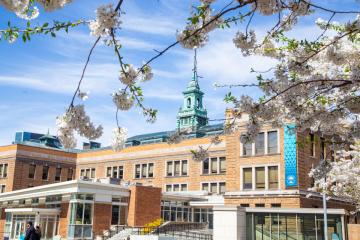
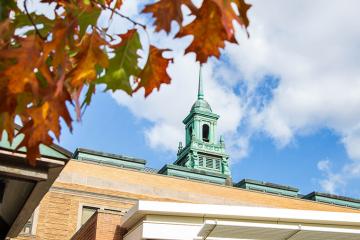
Massachusetts Locations
You may take classes at the Simmons campus in Boston's Fenway neighborhood or the SLIS West program at Greenfield Community College campus in Greenfield. Select programs are offered at the Eric Carle Museum of Picture Book Art in Amherst.
>85%
Retention Rate
On average, 85-90% of students entering the MS (LIS) degree program continue their programs of study after their first year at SLIS.
SLIS in the News
SLIS Professor Named 2026 Beta Phi Mu Awardee
Professor Laura Saunders, who serves as the associate dean of Simmons’ School of Library and Information Science (SLIS) and director of the Simmons Center for Information Literacy, has been selected as the 2026 recipient of the Beta Phi Mu Award by the American Library Association.
SLIS Professor Awarded 2026 Margaret Mann Citation
School of Library and Information Science (SLIS) Professor and Director of Libraries and Librarianship Concentration Daniel Joudrey is the recipient of the 2026 Margaret Mann Citation.
The Impact of Freedom of Information on Libraries, Archives
In honor of Freedom of Information Day earlier this month, we spoke to two faculty members of the School of Library and Information Science (SLIS) about the importance of the Act the day commemorates, and how those outside the library profession can access information from the government.
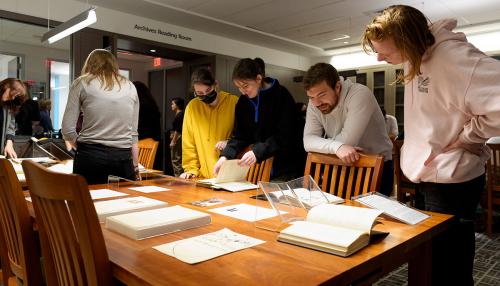
Beyond the Glass: Simmons Women and the Archives
University Archivist Kelsey M. Kolbet '21MS/MA, graduate of the dual degree program in archives management and history at Simmons University’s School of Library and Information Science (SLIS), recently offered a virtual presentation of items from the Simmons Archives. A perfect complement to Women’s History Month, the presentation highlights how women’s history and Simmons’ history are closely intertwined.

SLIS Deans Discusses Serendipity for NHPR
Dr. Sanda Erdelez, dean of Simmons’ School of Library and Information Science, was recently featured in New Hampshire Public Radio (NHPR) for a segment on serendipity.

Strengthening Information Literacy in Divided Times
Generative AI, rapid information exchange, and political polarization have reshaped the way we interact with information. A few faculty weigh in on the risks involved in using and the importance of detecting AI in the information we consume.
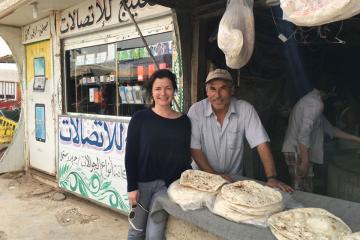
Preserving Food and Culture in a Refugee Camp
Dr. Karen E. Fisher, professor at the University of Washington Information School, visited Simmons as a recipient of the 2025 Allen Smith Visiting Scholars Fellowship. Her keynote presentation, “Countering Domicide: Preserving Indigenous Knowledge using Large-Scale Ethnography and Participatory Design,” focused on her work with Syrian refugees.
SLIS Forms Partnership with University of Maine at Augusta
Through a new partnership, undergraduate library and information science students at UMA will be able to fast track their graduate education at Simmons.
Upcoming Events
Contact Us
School of Library and Information Science
The School of Library and Information Science (SLIS) is a national leader with top-rated faculty, prestigious alumnae/i, and great locations in Boston and SLIS West (Greenfield, MA and Amherst, MA).