
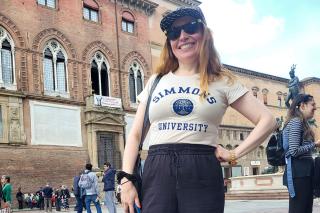
Coming to Simmons for Fulbright Experience
Finnish Illustrator Pirita Tolvanen has experience creating artistic representations of data for picturebooks. In 2020, she was able to interpret graphs and charts showing COVID-19 cases as they spread globally. This made her wonder: what about the people who lack this skill?
This inspired her to apply for an ASLA-Fulbright Mid-Career Professional Development Grant — funding offered by the Fulbright Finland Foundation for field specialists to conduct research or professional development in the US — to study data visualization in children’s nonfiction picturebooks.
When she learned about Simmons University’s Center for the Study of Children’s Literature, she thought it was the perfect place for her research, especially given the breadth of children’s books published in the US. She reached out to Professor and Chair of the Department of Literature and Writing and Graduate Program Director of Children's Literature Cathryn Mercier and received a response the same day.
“I felt so welcome; it felt like the right place for me,” says Tolvanen.
Tolvanen dove into her research on campus in spring of 2022. “I loved it; I can’t say it any other way! My semester started with a meeting with Cathie that morning,”she says. “She and Assistant Teaching Professor Shelley Isaacson were my biggest supporters, finding books, guiding my research, and introducing me to people in the industry.”
While in Boston, Tolvanen spent time in the Boston Public Library and local bookstores, but the Center’s “Book Nook” was her main research source, focusing on books published in the US in 2021. She also took advantage of Simmons’ relationship with the Eric Carle Museum of Picture Book Art (Amherst, MA).
“I went there several times. I hadn’t been to that type of museum before,” she says. “I also visited the Michelson Gallery in Northampton. In Finland, there isn’t a museum that is so focused on children’s picturebooks.”
Understanding Visualizations of Data
In a blog post for the Fulbright Finland Foundation, “Why We Need Data Visualization in Children’s Picture Books, Too,” she wrote, “Data visualization is much more than charts and graphs, but charts and graphs are crucial to understand in the world of today. When you are familiar with them, you are prepared to behold more difficult ones. And perhaps better prepared to understand the wicked problems of the world of today and tomorrow.”
When discussing her research subject among adults, Tolvanen notes many readers feel inadequate understanding visualizations of data. That feeling interferes with their ability to do so effectively. Also, artists often lack familiarity with the concept.
“There is a difference between reading and understanding; that’s an important distinction,” says Tolvanen. Her advice for developing the ability to understand data visualization? “The only way to learn how is to read more of them and become comfortable reading them. Any time a data visualization is used in a book or article, in the text or caption linked to those visualizations, I would include a summary of the main takeaway of that chart.”
In children’s nonfiction picturebooks, Tolvanen encourages artists to include more data in their artwork. “Children know pictures. They are not afraid to spend time with them, if they are interested in them. Children are more ready than we give them credit for to take in data visualization. I would like there to be more data shown to them, in nonfiction picture books and other books as well.”
Core Concepts When Visualizing Data
“When visualizing data, there are so many elements to consider: from the visual point of view, to truthfulness and clarity,” says Tolvanen. “Sometimes the difference between misinformation and truthfulness is not a wide one.”
One element that struck her as lacking clarity in many nonfiction picturebooks, particularly in how they visualize data, is the passage of time, she says. “It’s supposedly obvious, but timelines are often used as visual lists, but time itself is not visualized.”
As an example, a children’s nonfiction book about artificial intelligence (AI) included a timeline that began in ancient Greece, then jumped to the 1950s. While the intent was to show that ideas underpinning AI have been around for a long time, the timeline was incomplete and misleading.
From a visual point of view, it made it look like ancient Greece was 100 years ago. It could have stated this more clearly in the text, but the images lacked clarity,” she says.
While timelines may seem “boring,” Tolvanen says, “Timelines have such potential to show scale. When we are looking at data, "a lot of the charts we see in our daily media consumption have a timeline as their X-axis, showing changes developing over time. Timelines are an essential element of data visualization.”
This concern about clarity and truthfulness has altered her own approach.
“When I started to put together a data visualization, I would add the labels last. This is a common thing to happen with many artists; we think that we will add the labels later on. But not everyone is as fluent in the material as we are, and the labels and instructions and essential texts and numbers should be included in the visualization as we are sketching it out,” she says. “I like to see how the data looks in different formats, including the words and labels.”
‘Authenticity in the AI Era’ at the Bologna Children’s Book Fair
In April, Tolvanen presented a masterclass at the Bologna Children’s Book Fair in Bologna, Italy, “Drawing Reality: Authenticity and New Conventions in the AI Era.”
The talk was fueled by her exposure to children’s nonfiction published in the US; Isaacson helped her create the presentation.
“There is so much back matter in those books,” she says, referring to the lists of resources included in the last pages of many nonfiction books. “We don’t do that as much in Finland. There is a lot of nonfiction for children that doesn’t mention where the information came from.”
In the age of AI, backmatter is now all the more crucial.
“We need to look at information and data in a transparent way,” she says. “It’s not just my responsibility to share the information, but to show where the information came from, the choices that were made, and the sources that I trust.”
She noted that data can be represented in historical or technical illustrations, as well as in the background work illustrators do to research interiors, clothing, and portraits of a particular time period. She argues transparency about research is essential to fight disinformation in the age of AI.
As Tolvanen explained in her talk, “It’s not just about evaluating if something is true; you have to evaluate the evidence you have.”
For example, Tolvanen recommends The Universe in You: a Microscopic Journey by Jason Chin (Holiday House, 2022), which includes an illustrator’s note describing the elements of artistic license he incorporated, as well as his reasoning for doing so.
“The book visualizes the molecular world, so he added color to make the cells more simplified,” says Tolvanen. “He shared his process, explaining why he made these visual choices in order to make it easier for children to understand.”
Writing and Illustrating
In addition to her blog and work as an illustrator, Tolvanen is also an author. She wrote and illustrated a nonfiction picturebook and a novel, both published in Finland. Her novel, The Black Lion (2025), is a young adult fantasy that she worked on while she was in Boston.
“There are so many more illustrated novels in the US,” she recalls. “I knew I wanted to illustrate my book. It gave me so many ideas to read so many illustrated novels when I was there. It helped me think about that book.”
Her next nonfiction picturebook, The Nurse Who Changed the World: How Florence Nightingale Revolutionized Hospitals, co-authored by Annette Bay Pimentel and illustrated by Valerya Milovanova, is slated for publication in Spring 2028 by S&S/Beach Lane Books. She met Pimentel at the Bologna Book Fair.
“During my presentation, I mentioned examples of data visualization in history, and one was created by Florence Nightingale. I said, ‘Someone should make a children’s nonfiction picturebook about this!,’” she says.
After doing some background research, Pimentel later contacted Tolvanen and asked if she wanted to collaborate on the book.
“It has been a total pleasure to work on that book. Florence Nightingale was a force of nature. It’s astonishing all that she accomplished, over a century ago,” she says. “She had a passion for data and statistics, and her use of data made a huge impact.”